 READERS SURVEY: PART ONE
Over the past two weeks I have shared with you highlights from indieBRAG’s Second Annual Survey among Authors of a B.R.A.G Medallion book. I would now like to present the key findings from the Reader Survey, and compare the results to 2013 where relevant. I will provide these results in three parts, beginning today with the Reader Survey: Part One.
READER SURVEY: PART ONE
Overview
As was the case with the Author Survey, participation in this year’s survey among our readers declined versus last year. Specifically, it dropped to 15%, which compares to 25% in 2013. While we were disappointed by this lower participation rate, the sample was still large enough to provide some useful, albeit directional, findings.
The results I will present in Part One and Two reflect the readers’ general views and preferences unrelated to their roles as indieBRAG reviewers. In Part Three, I will highlight several key findings that pertain directly to our readers’ experiences in reading indieBRAGsubmissions.
Preferred Format for Books
- Like last year, a little over half of our readers prefer reading an eBook. Only ten percent prefer trade paperbacks while forty percent read either.
- Very few readers favor mass market paperbacks and no one preferred hard cover.
- When those who prefer eBooks were asked what they would do if a book was only available in print, 70% said that they would buy the trade paperback version, while 25% said they would wait for the eBook version. Importantly, the remaining 5% said they would forget about the book. While this is a small number, it demonstrates that an author who does not offer an eBook version will lose some potential buyers.
- In a separate question, respondents were asked if they listen to audio books. Forty-one percent said they did, which was down from 52% in 2013.
Preferred Type of eReader
- Consistent with last year’s results, approximately seven out of ten respondents who read eBooks use a Kindle, while the number who read on a Nook remained at less than 10%.
- Two other interesting findings were that the percent of readers who read eBooks on a tablet jumped from 7% in 2013 to 17% this year; and while no one reported reading an eBook on a Smartphone last year, this year 4% said they did.
Price of eBooks
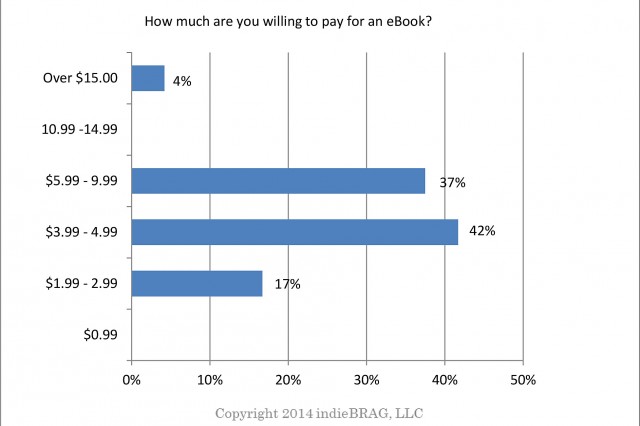
Observations:
- The number of readers who are willing to pay between $5.99 and 9.99 for an eBook remained relatively flat versus 2013 at 37%.
- However, the percentage of readers who only want to pay between $3.99 and 4.99 increased to 42% compared to 32% in 2013.
- Those who wanted an eBook to be priced at $1.99 to 2.99 rose slightly to 17% versus 14% in 2013.
- This year no one wanted an eBook to cost under a dollar whereas last year 8% of respondents did. While qualitative in nature, this may reflect the general trend away from under a dollar pricing.
Price of Print Books
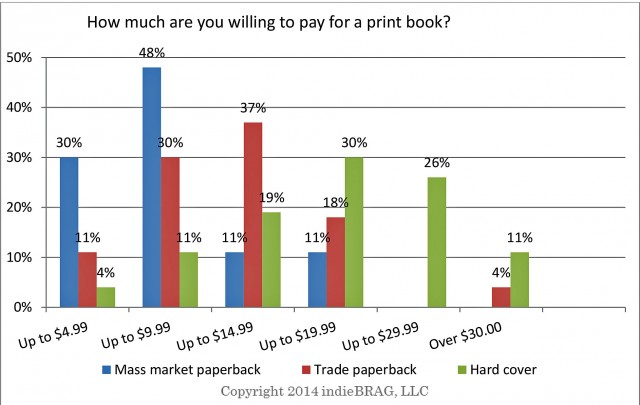
Observations:
- There were no significant differences in attitudes towards print book pricing uncovered in this year’s survey versus 2013.
- As might be expected, the desired pricing for print books skewed markedly based on the nature of the book’s binding, with mass market paperback books at the low end and hard cover at the high end.
- The ideal pricing for trade paperbacks seems to be under 14.99, whereas hard cover books should be priced under $30.00 and preferably below $20.00.
Leave a Reply